Bitcoin : Weekly Analysis
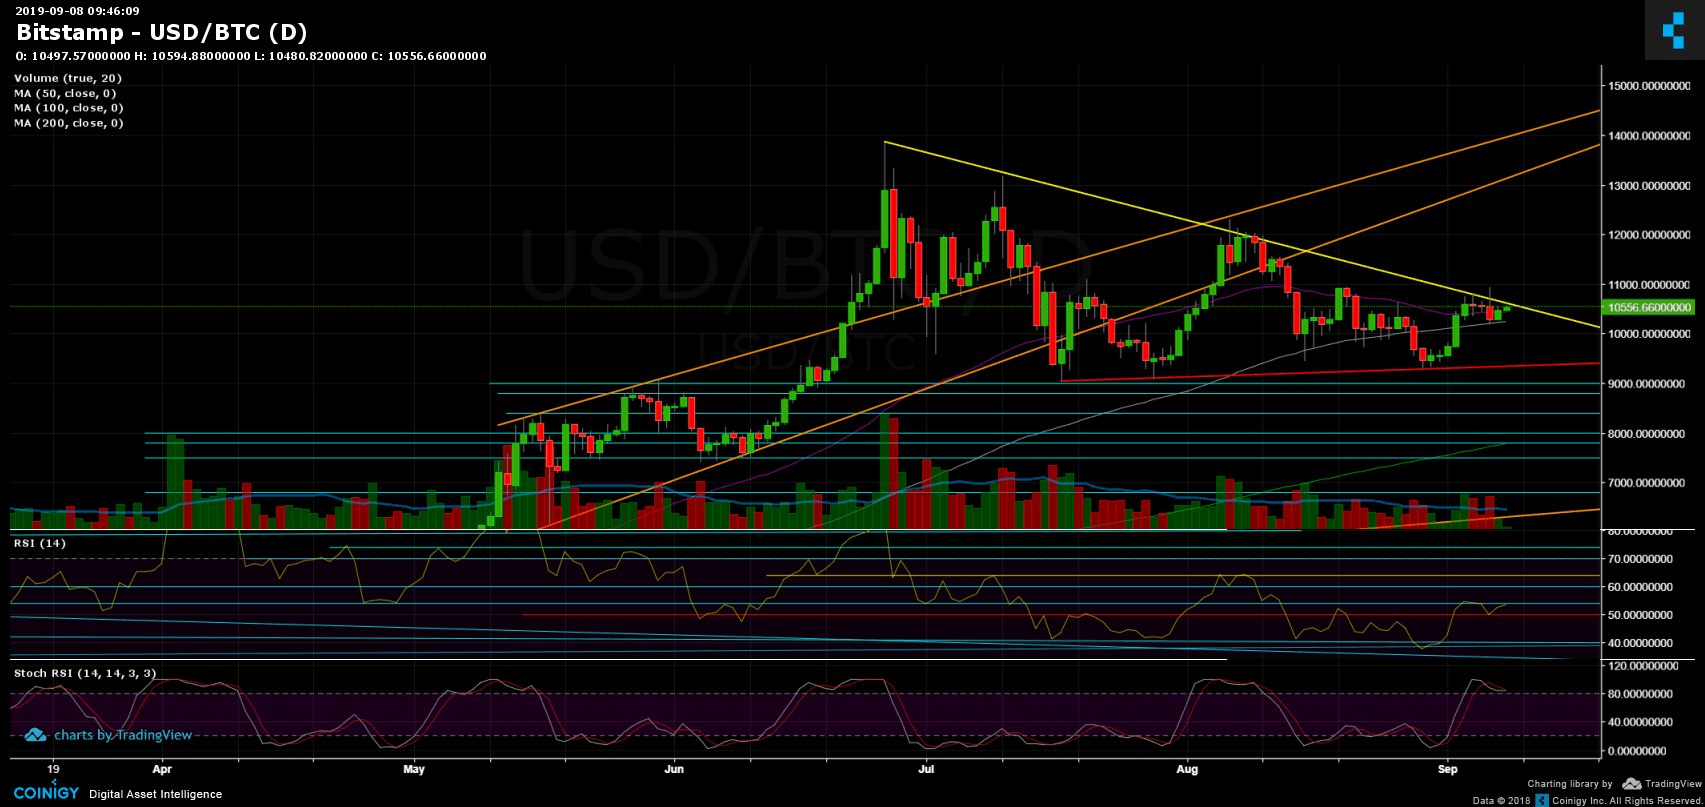
Over the last week, the positive trend and the upper resistance levels in technical analysis show that they should be considered for future price movements. The downward trending line was tested 4 times in this week and “prevents” Bitcoin to reach new yearly highs after June peak in $ 13.800.
It is common in technical analysis, when a trending line is tested several times, there is an unexpected move either upside or downside. This move was downside in this case as Bitcoin price fell by $ 700.
The resistance levels that were met in the downfall were at the 100 - day moving average, showing that many investors remain stable at this point. This is obvious if we see the three previous weeks when the price find resistance in the same point, touching the 100 – day moving average.
Even if the price has climbed a little since then, the signals show that we enter a bear market which can led the price to $ 10.000. We will wait for the news and how many of the above will be confirmed.